chart.js extension released (paid).
Posted: Wed Nov 20, 2019 11:08 am
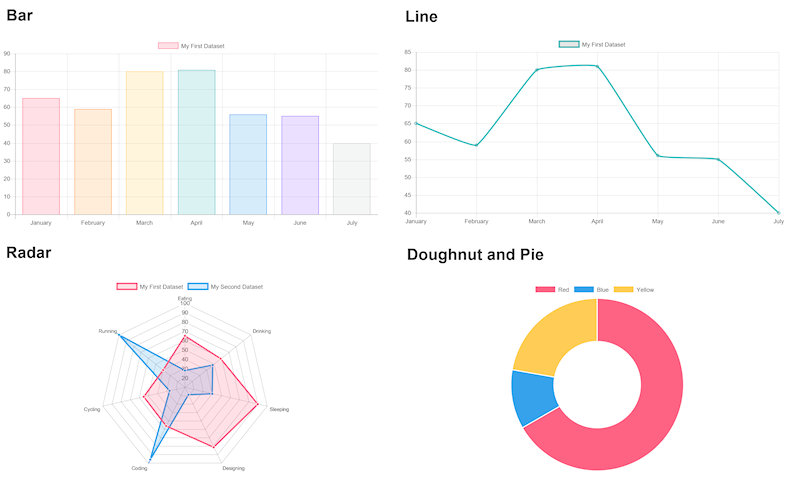
chart.js is a Javascript library that allows designers and developers to draw all kinds of charts using the HTML5 canvas element. For example, line charts, area charts, bar charts, pie charts etc. It’s a self-contained script so it does not depend on external services. The data for the charts can be loaded from different data sources (MYSQL, CSV, JSON, MDB).
Features
• Area, Bar, Column, Line, Stacked, Donut, Pie, Polar area and Radar.
• Load data from MySQL, CSV, MS Access (MDB) or JSON
• Animation support
• Many styling options

More information:
https://www.wysiwygwebbuilder.com/chartjs.html
The demo version can be downloaded via the Extension Manager (Menu->Tools->Extension Manager->Online Gallery->Miscellaneous).
Purchase for $7.95
https://secure.2checkout.com/order/chec ... T=1&CARD=1
Features
• Area, Bar, Column, Line, Stacked, Donut, Pie, Polar area and Radar.
• Load data from MySQL, CSV, MS Access (MDB) or JSON
• Animation support
• Many styling options

More information:
https://www.wysiwygwebbuilder.com/chartjs.html
The demo version can be downloaded via the Extension Manager (Menu->Tools->Extension Manager->Online Gallery->Miscellaneous).
Purchase for $7.95
https://secure.2checkout.com/order/chec ... T=1&CARD=1